Examples and Screenshots
Clicking on the following images should yield
higher-resolution versions.
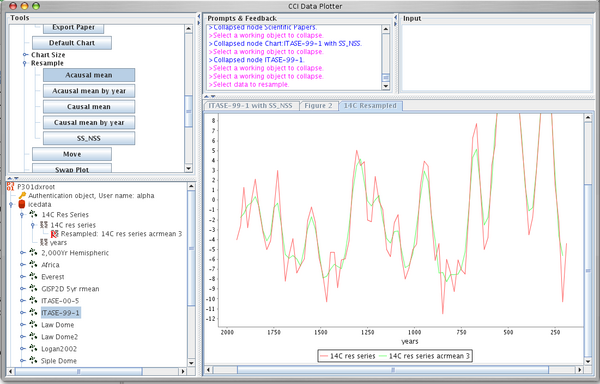
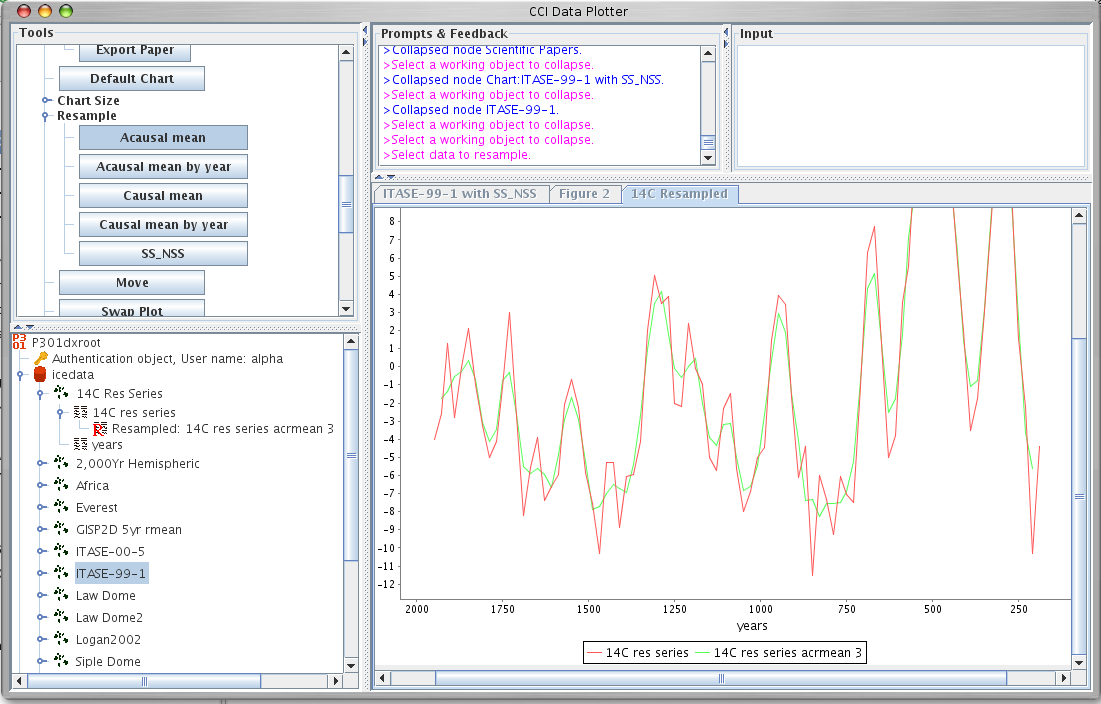
| Figure 3: | A chart with interactively resampled data. |
|
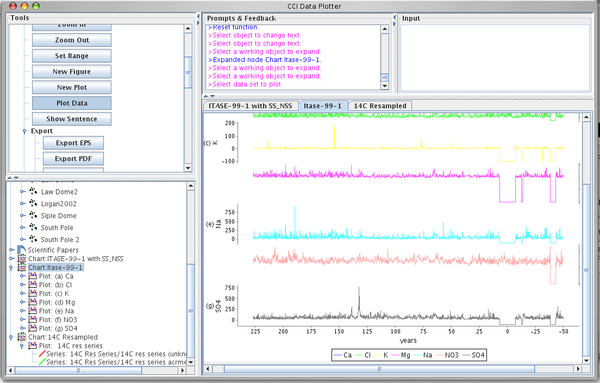
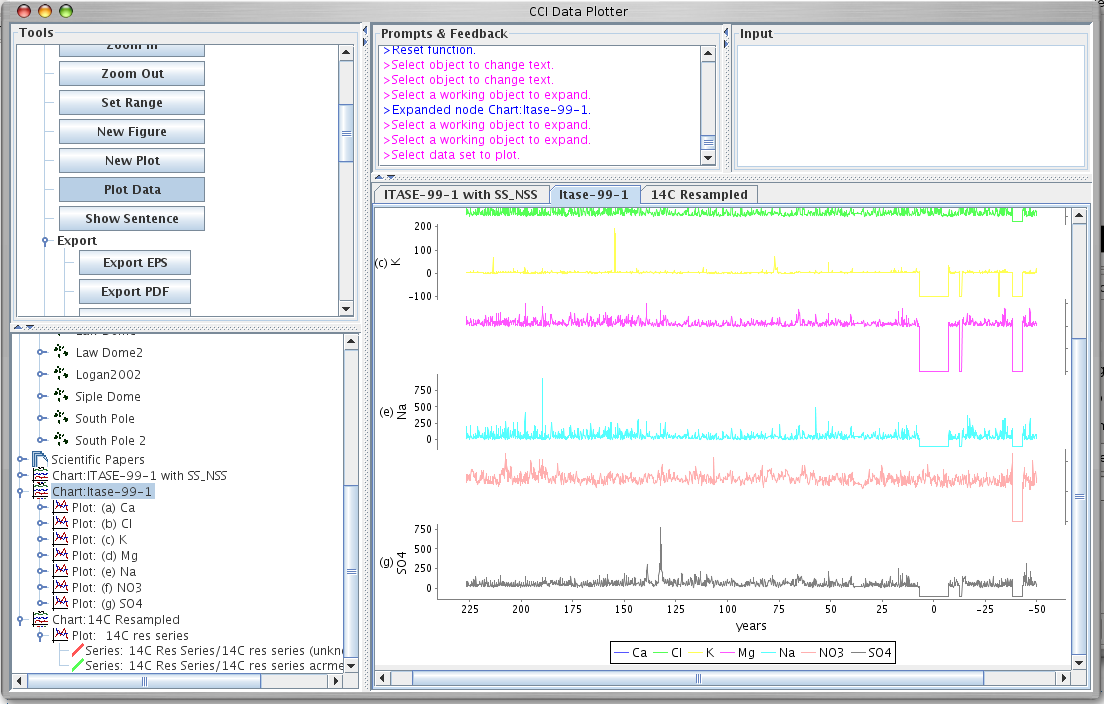
| Figure 4: | A chart with multiple ice-core data plots. |
|
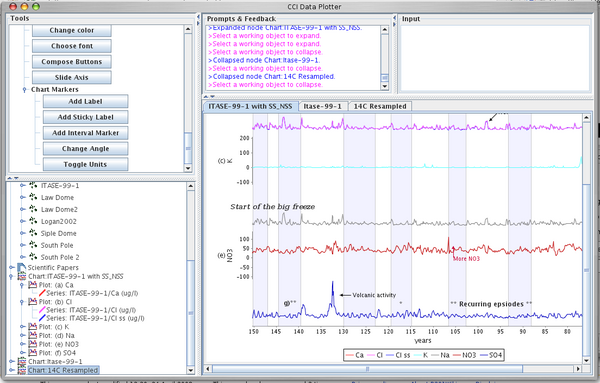
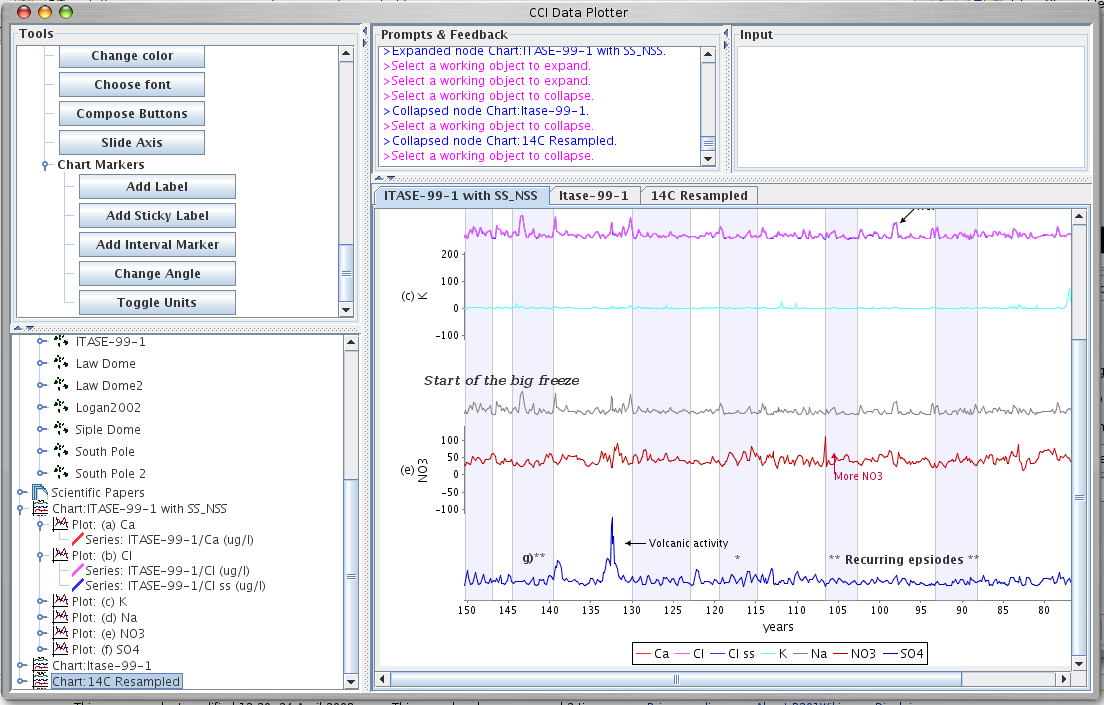
| Figure 5: | A chart illustrating the use of markers. |
|
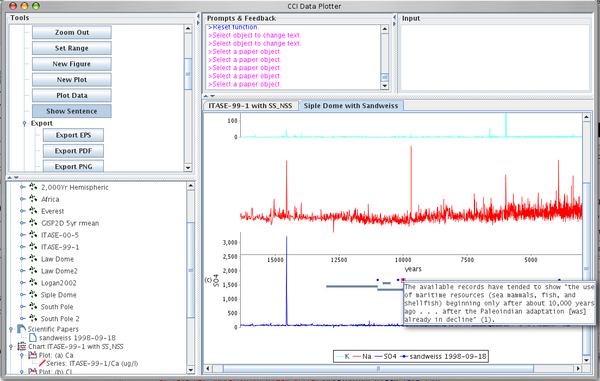
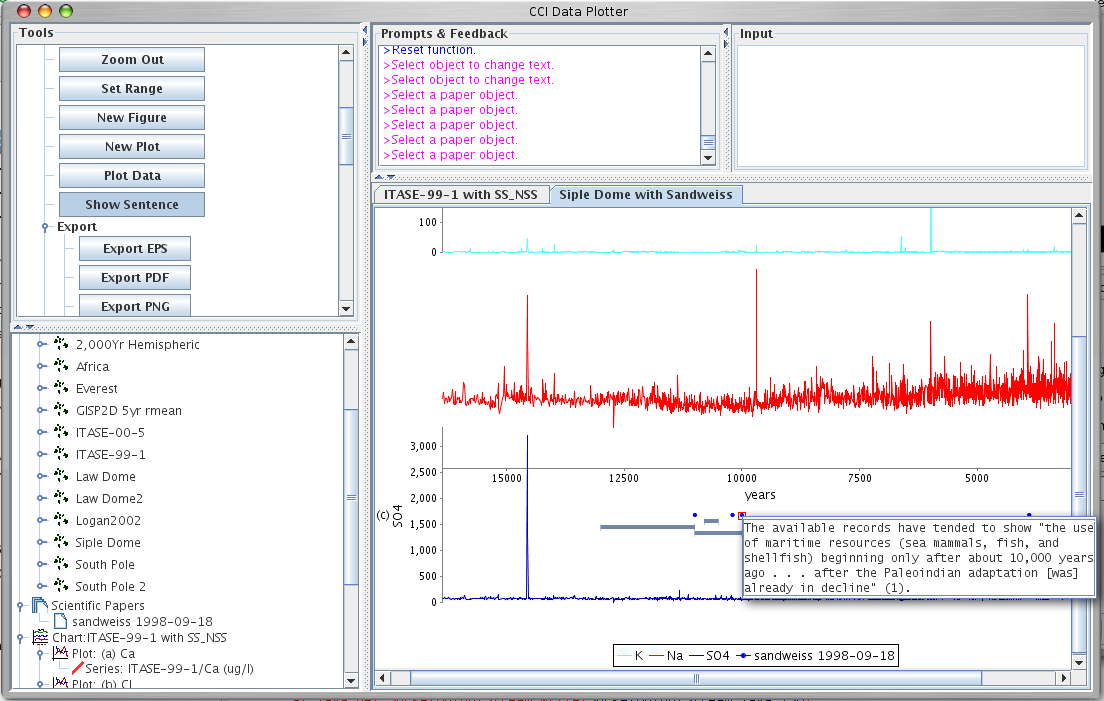
| Figure 6: | A chart that integrates data extracted from a paper [2] with data from ice cores. |
|